Bethlehem ConnectPlanning phase — home

Energy & Sustainability

Electric transit, with every source counted honestly

Planning phase. An independent plan; nothing is funded or built yet. What this means

Bethlehem Connect would run on electricity delivered by the grid, with solar, batteries, regenerative braking and ground-source heat pumps each doing a specific job. The author's aim is natural energy only. Numbers are screening estimates for Phase 1, not designs.
Phase 1 · screening estimates

Natural energy only: the author's aim

The author's aim (21 October 2026), not something secured. No energy supply, site or utility agreement exists, and nothing is funded.

Sources

  • Solar
  • Wind
  • Hydro, only where permitted, with fish passage and reviews
  • Geothermal
  • Heat recovery

Storage

Batteries, thermal storage, or pumped storage where the land allows.

The grid

Power would cross the grid only under the utility's (PPL's) and Pennsylvania's rules.

What this does not claim

Today's regional grid is not all natural energy: in 2023 it still emitted CO₂, which the estimate below counts (EPA eGRID2023). This plan never calls grid power renewable. Station solar would equal only about 17–25% of the buses' yearly energy (screening), and wind, hydro and pumped storage have no site, size or figure here. No natural-gas, diesel or diesel-hybrid bus is proposed, even as a fallback: if chargers or winter range are not proven in time, the start would wait (our judgment from that aim).

Phase 1 annual balance (screening)

2.99–3.53 GWh

electricity per year for the Spine and River Line buses

0.60–0.75 GWh

from station solar (~600 kWdc assumed) — about 17–25% annual equivalence

~800–950 t

CO₂ per year at the regional grid average (eGRID2023 RFCE)

15 buses

battery-electric fleet incl. spares (12 in peak service at 10-minute headways)

Traction energy: 2.99–3.53 GWh/yr

Station solar: 0.60–0.75 GWh/yr

Bars to scale (low–high band). Solar peaks at midday in summer, while charging peaks overnight and in winter — so solar is an annual equivalence, not direct power.

What each part does
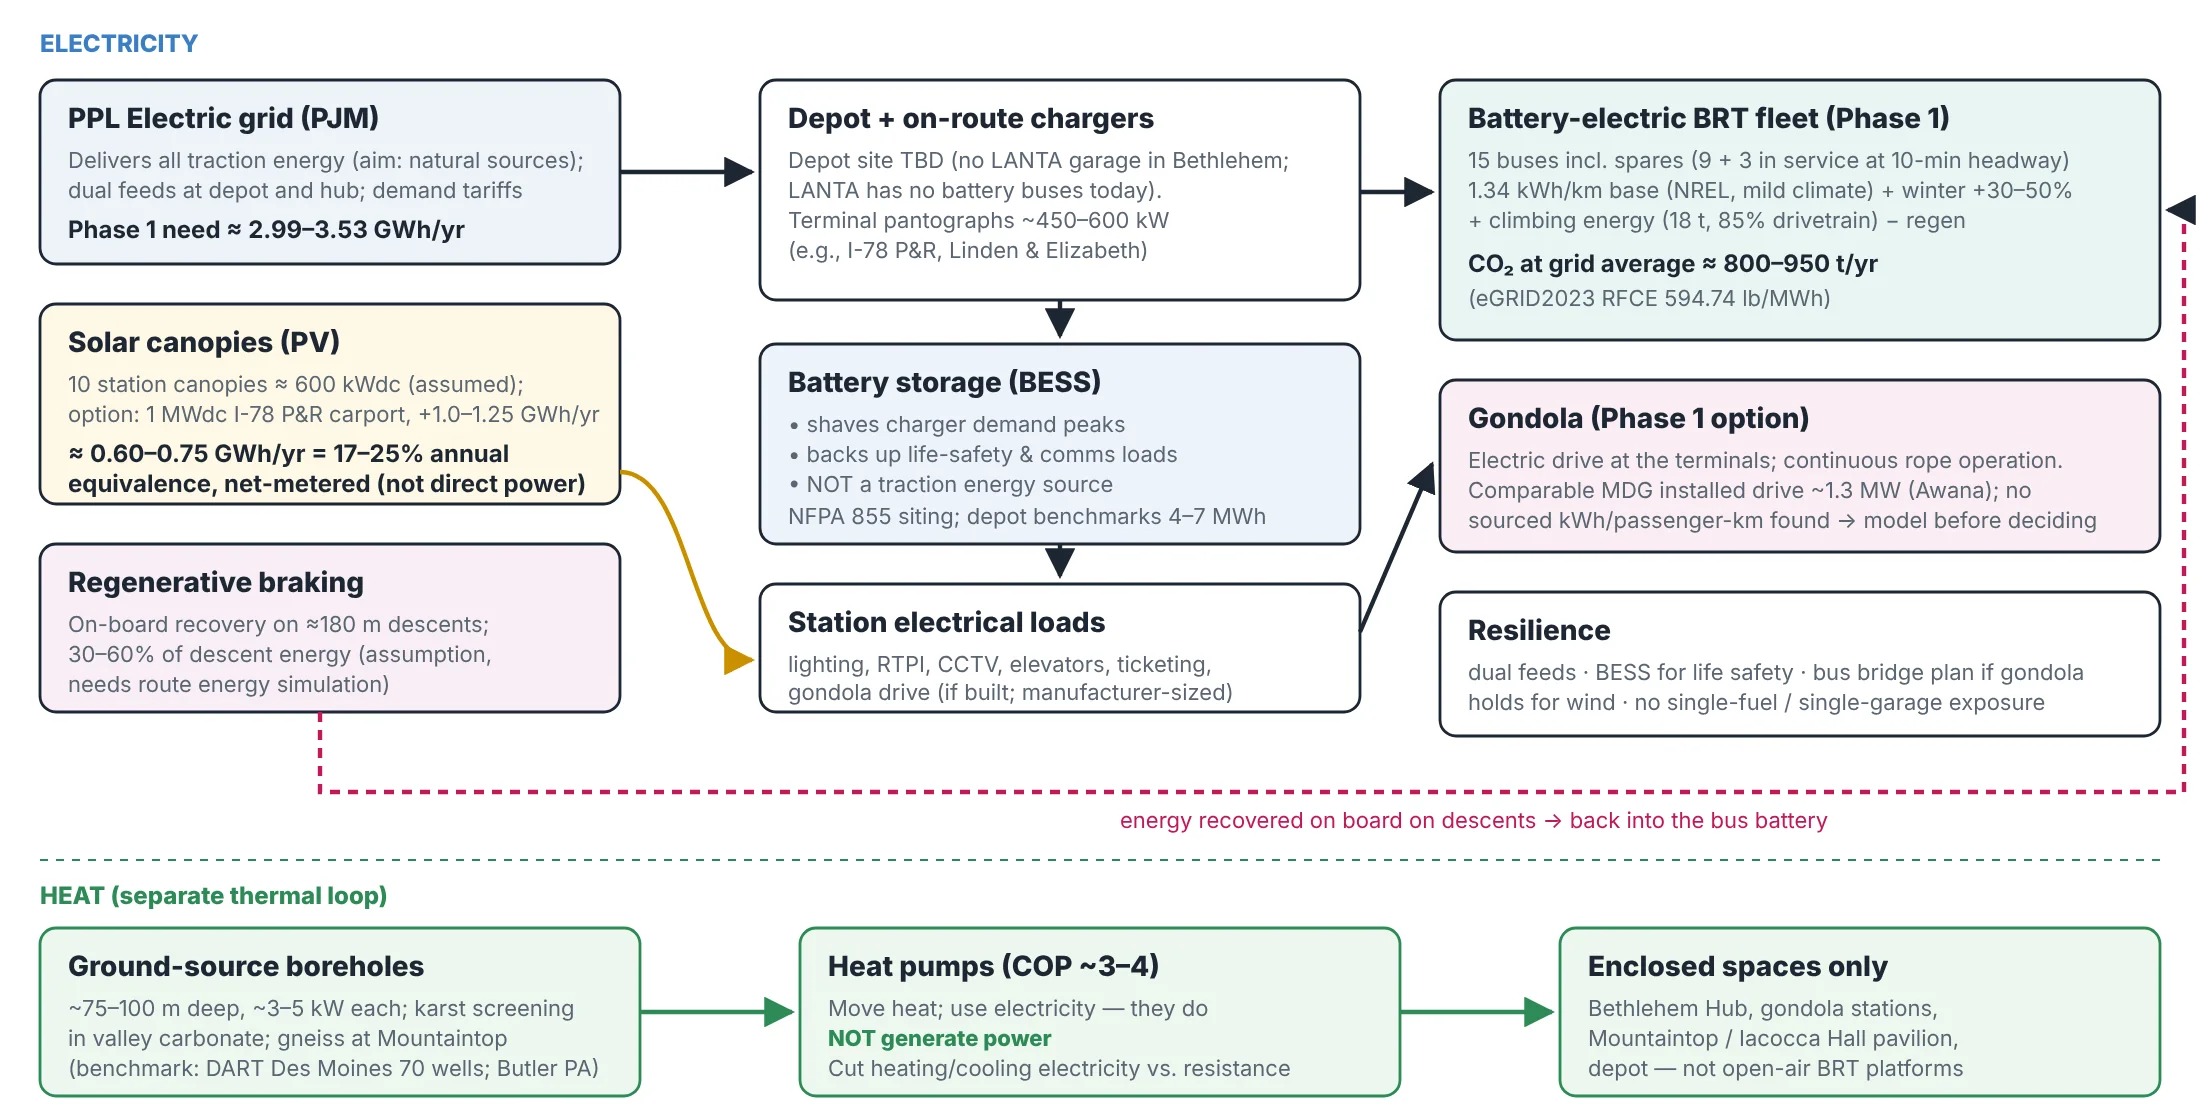
Energy strategy. Electricity on top; a separate thermal loop for enclosed spaces below. Where the diagram says solar is net-metered, that is an assumption: net-metering eligibility is still to confirm.

Grid-backed electric buses

All traction energy would arrive through PPL's grid, with dual feeds at the depot and hub; the aim above is that natural sources supply it. Base use of 1.34 kWh/km (NREL, mild climate) is a lower bound: winter adds 30–50% for four months, and climbing South Mountain adds more.

Chargers

Depot charging (site TBD — LANTA has no garage in Bethlehem and no battery buses today) plus terminal pantographs of ~450–600 kW at the I-78 P&R and Linden & Elizabeth.

Solar canopies

About 320 m² of PV per station (canopies plus shelter or building roofs) ≈ 600 kWdc network-wide. An optional 1 MWdc carport at the I-78 P&R could add ~1.0–1.25 GWh a year. Net-metering eligibility is to confirm.

Battery storage

Shaves charger demand peaks and backs up life-safety and communication loads. Not a traction energy source. Sited under fire code NFPA 855.

Regenerative braking

Buses recover energy on the ~180 m descents — an assumed 30–60% of descent energy, which needs a route energy simulation to confirm.

Ground-source heating & cooling

Boreholes ~75–100 m deep (~3–5 kW each) feeding heat pumps (COP ~3–4) for enclosed spaces only — the Bethlehem Hub, gondola stations, the geology pavilion at Mountaintop / Iacocca Hall and the depot. Heat pumps move heat; they don't generate electricity. Karst screening is needed in the valley.

Where each element could go

Proposed, subject to site study.
  • Station
    1 · I-78 P&R
    Solar
    carport (largest)
    Charger
    terminal pantograph
    Battery
    charger peaks
    Heat pump
    —
    Note
    candidate charging hub; depot site TBD
  • Station
    3 · Goodman / Stabler
    Solar
    canopy
    Charger
    event layover (option)
    Battery
    charger peaks
    Heat pump
    gondola terminal (option)
    Note
    Lehigh's 3.1 MWdc array is separate
  • Station
    4 · Mountaintop / Iacocca Hall
    Solar
    canopy + pavilion roof
    Charger
    —
    Battery
    life-safety (gondola)
    Heat pump
    station + pavilion
    Note
    regeneration on both descents
  • Station
    7 · Third St / SteelStacks
    Solar
    canopy
    Charger
    —
    Battery
    life-safety
    Heat pump
    —
    Note
    equipment above flood level
  • Station
    8 · Downtown / Hub
    Solar
    low-profile (heritage)
    Charger
    —
    Battery
    life-safety (hub)
    Heat pump
    hub building (karst screening)
    Note
    dual utility feeds
  • Station
    10 · North Bethlehem
    Solar
    canopy
    Charger
    terminal pantograph
    Battery
    charger peaks
    Heat pump
    —
    Note
    layover site TBD
  • Station
    2, 5, 6, 9
    Solar
    canopy
    Charger
    —
    Battery
    —
    Heat pump
    — (open-air)
    Note
    standard kit

Honesty rules

Solar does not directly power vehicles. Heat pumps move heat; they do not generate electricity. Batteries shave peaks and back up life-safety loads; they are not a traction source. Regeneration depends on a route energy simulation.

Accessibility is part of sustainability

Level boarding, redundant elevators, audio and visual real-time information and step-free links make the system usable by everyone — see Proposed Community Stations.

The natural-energy aim is the author's (21 Oct 2026). Assumptions: 10-minute headway, 18 h/day, 328 equivalent days; 18 t buses; 85% drivetrain; 10% charging losses; PV 1,000–1,250 kWh per kWdc (replace with PVWatts). Sources: NREL Foothill Transit evaluation; NREL/CTE/Cornell winter studies; EPA eGRID2023; PA PUC net metering; ABB/Schunk pantograph data; DART Des Moines and Butler PA geothermal transit centers. Retrieved 17 Oct 2026.